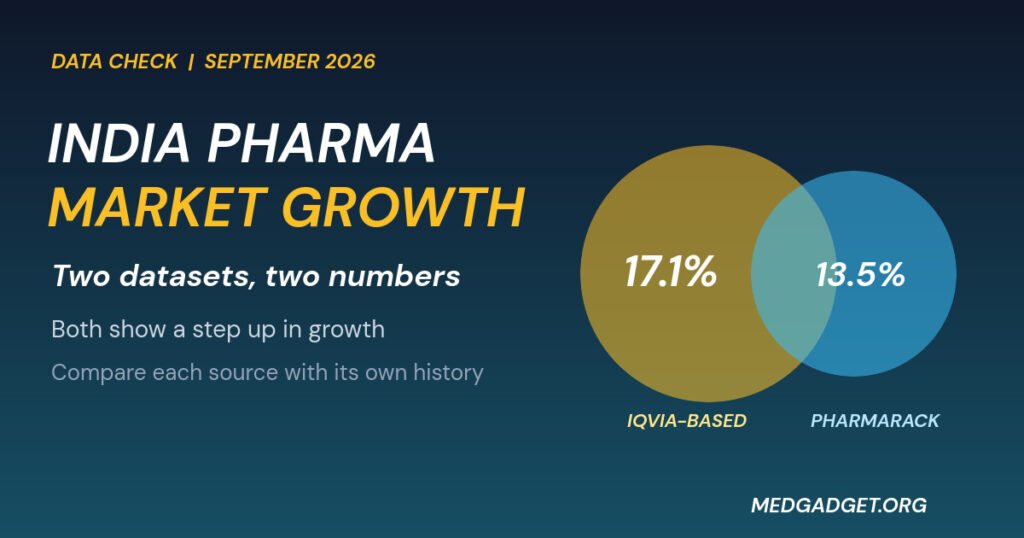

Two data sets tell two different stories about India pharma market growth in September 2026, and the difference is the real news. Brokerage research that uses IQVIA data puts domestic sales at about ₹25,276 crore, up 17.1% year on year, the fastest month in three years. A separate release based on Pharmarack data puts value growth at about 13.5%. Both show acceleration. They disagree on how much.
This article explains why the numbers differ, what both agree on, and how to read headline market growth without being misled.
India pharma market growth: key takeaways
- IQVIA-based research: ₹25,276 crore, up 17.1%, with unit growth of 5.4%.
- Pharmarack: value growth of about 13.5%, unit growth of about 3.4% to 3.5% (a two-year high), price growth of about 6.2%.
- Both show chronic and cardiac medicines growing faster than the market, and both show respiratory and anti-infective sales as weak.
- The gap, about 3.6 percentage points by our subtraction, reflects different sources and definitions and not necessarily an error.
Why India pharma market growth numbers differ by provider
Market trackers do not count every sale in the same way. Some collect data from a panel of distributors or stockists and scale it up; others draw on different parts of the supply chain or define the market with different product lists. A provider may include or exclude certain categories, treat institutional sales differently, or update its sample at different times. The result is that two honest trackers can report different growth for the same month.
For readers, the practical rule is to compare a provider only with its own history. The IQVIA-based research reports 13.1% for August and 6.6% for September 2025, so 17.1% is a jump within that series. Pharmarack’s own series shows about 10.2% in January, about 11% in February, about 10.1% in March, 13.3% in June, and 13.5% in September, so its September number is a new high within its series.
What the IQVIA-based research says about India pharma market growth
According to the research, September sales were about ₹25,276 crore (about ₹253 billion), and the trailing 12-month total was ₹2,75,072 crore, up 13.2%. For the July to September quarter, sales were about ₹74,610 crore, up 14.7%, compared with 13.9% in the previous quarter. The research says volume is now the largest contributor to growth, with unit sales up 5.4% in September.
Therapy growth was led by vitamins, minerals and nutritionals (about 22%), anti-diabetic medicines (about 21%) and cardiac medicines (about 20%). Chronic therapies grew about 19% in the month against about 16% for acute ones. Respiratory medicines grew about 3% and anti-infectives about 9%.
What Pharmarack shows
Pharmarack reported value growth of about 13.5%, with price contributing about 6.2%, new products about 3.8% and volume about 3.4% to 3.5%. In cardiac medicines, which make up about 14% of market value, value grew 17.7%, with volume up 9.1%.
Within cardiac, lipid-lowering drugs, antiplatelet drugs, diuretics and heart failure therapies all showed double-digit volume growth. Anti-diabetes value grew 16.1%, mostly from new generic launches in GLP-1 and oral combinations such as empagliflozin, and not from volume, which was up about 1%. Oncology grew 21.6%.
Respiratory volume fell about 6.9% because the monsoon receded, hitting anti-asthma, COPD and cough-and-cold products. Pharmarack expects a recovery in November and December.
Where the data sets agree
- Growth in September was faster than at any point earlier in 2026 in each series.
- Volume growth was at a two-year high or close to it, which suggests broader demand and not only price increases.
- Anti-diabetic, cardiac and oncology therapies were growth leaders.
- Respiratory and anti-infective products lagged because of seasonal factors.
On the anti-diabetic drugs side, the sources differ on the cause: the IQVIA-based research points to higher sales of high-value brands, while Pharmarack points to new generic launches. These may both be true, since they describe different parts of the same segment, but we cannot tell from the material available. Related reading: our report on Sun Pharma’s global rights to lerodalcibep covers one cardiovascular product, and more is in pharmaceutical reports.
How to read a record month of India pharma market growth
A single record month can overstate a trend. Purchase timing by distributors, the arrival of new generics, and seasonal patterns can move one month’s sales more than underlying demand does. Quarterly and trailing 12-month figures are steadier. On that basis, the IQVIA-based research shows quarterly growth of 14.7% and trailing growth of 13.2%, which are better guides to the underlying pace than the headline 17.1%.
Risks and caveats on India pharma market growth data
- We have not seen the raw data or the methods behind either figure.
- The 17.1% number comes through brokerage research, and the Pharmarack numbers through a news release of its data; neither is an official statistic.
- Month-to-month swings can reflect timing and seasonality.
- The reported company-level and therapy-level figures may not add up neatly across providers.
In our assessment, the sound conclusion is that India pharma market growth has stepped up to the low-to-mid teens on a quarterly basis, led by chronic care and volume. Anyone using the 17.1% number should say which source it comes from.
What to watch next for India pharma market growth
- October data from both providers.
- Whether volume growth stays above 3%.
- Company quarterly results from the Indian pharma majors.
- Any change in medicine price rules from the Department of Pharmaceuticals or quality rules from CDSCO that could affect supply.
Frequently asked questions
What was India pharma market growth in September 2026?
About 17.1% per IQVIA-based research and about 13.5% per Pharmarack.
Why do the figures differ?
The providers use different samples and definitions.
Which India pharma market growth number should I use?
Use one source consistently and name it. Compare it only with its own earlier months.
What is driving India pharma market growth?
Chronic therapies, rising volumes, new launches and oncology, according to both sources.
How we reported this: we relied on brokerage research using IQVIA data and a Pharmarack data release, both as reported, and the websites of the bodies named. Figures labelled as ours are our own calculations. Last updated: 15 October 2026. This article is news reporting and not investment advice.