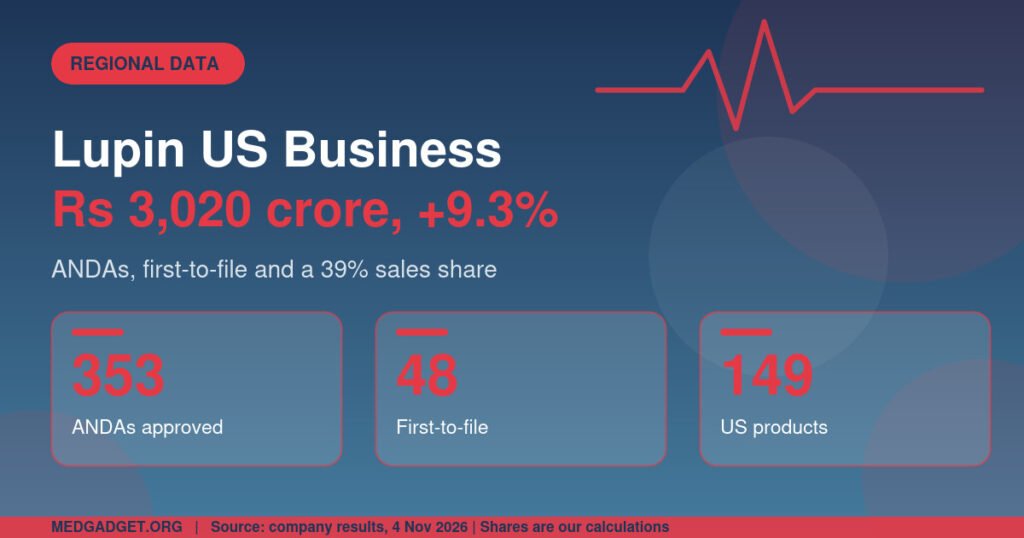

The Lupin US business was the largest contributor to sales in the quarter ended 30 September 2026, at ₹3,020.2 crore, up 9.3% from a year earlier and about 39% of consolidated sales. Reported on 4 November 2026, the figures show a US franchise growing more slowly than the group, whose sales rose 14%, and a regulatory pipeline of 429 cumulative ANDA filings, 353 of them approved. This article reads the US numbers in context, explains the regulatory terms and notes what the company has not disclosed.
Key takeaways on the Lupin US business
- US sales: ₹3,020.2 crore, up 9.3%, about USD 317 million by the company’s conversion.
- Share of group: about 39% of ₹7,785.5 crore consolidated sales (our calculation: 38.8%).
- Quarter activity: four ANDA approvals, one 505(b)(2) NDA approval and one US launch.
- Portfolio: 149 US generic products marketed; 429 ANDA filings cumulative, 353 approved.
- Pipeline: 48 first-to-file opportunities, 21 of them exclusive; 94 drug master files.
- Group profit fell 22.2% even as sales grew 14%.
What the regulatory terms mean
An ANDA, or abbreviated new drug application, is the route by which a generic version of an approved medicine is cleared in the US, as the US FDA explains on its website. A first-to-file opportunity refers to being among the first applicants for a product, which can lead to a period of exclusivity if conditions are met; 21 of the 48 are described as exclusive. A drug master file is a confidential submission that supports applications, often for ingredients or manufacturing. A 505(b)(2) NDA is a route for products that rely in part on existing data, such as a new formulation. Lupin reports one such approval in the quarter.
Reading the US numbers
| US metric | Value |
|---|---|
| Sales | ₹3,020.2 crore, up 9.3% |
| Share of sales | About 39% |
| ANDA approvals this quarter | 4 |
| NDA 505(b)(2) approvals this quarter | 1 |
| Launches this quarter | 1 |
| Products marketed | 149 |
| Cumulative ANDA filings / approved | 429 / 353 |
| First-to-file opportunities | 48 (21 exclusive) |
By our calculation, 353 approvals out of 429 filings implies that about 82% of cumulative filings have been approved, with the rest pending or otherwise resolved; the company did not break down the remainder. The US grew 9.3% against 14% for the group, so the faster growth came elsewhere: other developed markets rose 45.7% to ₹1,182.3 crore, India rose 14.7% to ₹2,383.6 crore and API rose 20.2% to ₹308.6 crore, while emerging markets fell 3.5%.
Why pipeline counts do not equal sales
A large number of approvals shows regulatory capability, but revenue depends on launches, pricing and competition. Generic markets can see sharp price erosion when several competitors enter, which is why first-to-file and exclusive opportunities attract attention. The company reported only one US launch in the quarter, and gave no product-level sales, so the link between the pipeline and near-term revenue cannot be traced from the material available.
The life of a generic filing
For readers new to the process, a generic application typically moves through several stages: filing, a regulatory review that can include questions to the applicant, inspection of the manufacturing sites, and finally approval or a request for more data. Approval does not guarantee a launch, because patents, exclusivity held by others and commercial judgment all affect timing. Some approved products are never launched or are launched years later. That is why a ratio of approvals to filings tells us about regulatory success but not about revenue, and why the one launch reported in the quarter is as informative about near-term sales as the four approvals.
It is also worth noting that inspection history of the supplying plants can influence how quickly applications are cleared, but the company did not discuss inspection outcomes in the material available, so we make no inference about them.
Group profitability
At group level, net profit was ₹1,155.3 crore, down 22.2%, and EBITDA margin was 27.9% against 35.6% a year earlier. Employee costs rose 28.8%, manufacturing and other expenses 23.2% and depreciation, amortisation and impairment 53.4%, while other operating income fell from ₹216.1 crore to ₹41.8 crore. The company did not attribute the cost rise to the US business specifically. R&D spending was ₹618.1 crore, or 7.9% of sales.
Timeline
- Quarter ended 30 September 2026: four ANDA approvals and one launch in the US.
- 4 November 2026: results announced.
- Ahead: further launches and approvals through the second half of FY27.
Market context
Acumen Research And Consulting’s Pharmaceutical Market report gives USD 1.5 trillion in 2022 and USD 2.8 trillion by 2032, a compound annual growth rate of 6.4% for 2023 to 2032, with North America at about 38%. The page also has a conflicting 38.4% growth line and was published in July 2024, so it is indicative only, and it is not specific to generics.
Our analysis
In our assessment, the US business is steady but not the growth engine this quarter. The pipeline numbers are strong and give optionality, but the quarter’s profit fall shows that margins, not approvals, are the near-term question. We would look for product-level disclosure and a cost explanation before drawing conclusions.
What is not disclosed
- US product-level sales and price trends.
- The identity of the quarter’s launch.
- Pending ANDA counts and expected approval timing.
- Cost drivers by region.
Risks and caveats
- Figures are from company results as reported; check against the filing.
- Market data are dated and inconsistent.
- Percentages marked as ours are our calculations.
- This article is news reporting and not investment advice.
What to watch next
- Q3 FY27 US sales and launches.
- Exclusivity outcomes on first-to-file products.
- Margin trend.
- US regulatory inspections.
General background
Related coverage: growth in the Indian pharma market. Company information is on the Lupin website. More in the Pharmaceutical category.
Questions readers are asking about the Lupin US business
How big is the Lupin US business?
₹3,020.2 crore in the quarter, about 39% of sales.
How many US generic products does Lupin market?
149.
Is the US growing faster than the group?
No. The US grew 9.3% against 14% for group sales.
FAQ
What is a drug master file?
A confidential submission supporting regulatory applications.
What is exclusivity?
A period during which other generic versions may not be approved.
What is 505(b)(2)?
An NDA route that relies partly on existing data.
How we reported this: figures come from Lupin’s quarterly results for the period ended 30 September 2026 as reported on 4 November 2026; market figures are attributed to Acumen Research And Consulting; calculations marked as ours are our own. Last updated 5 November 2026. This is news reporting and not investment advice.