
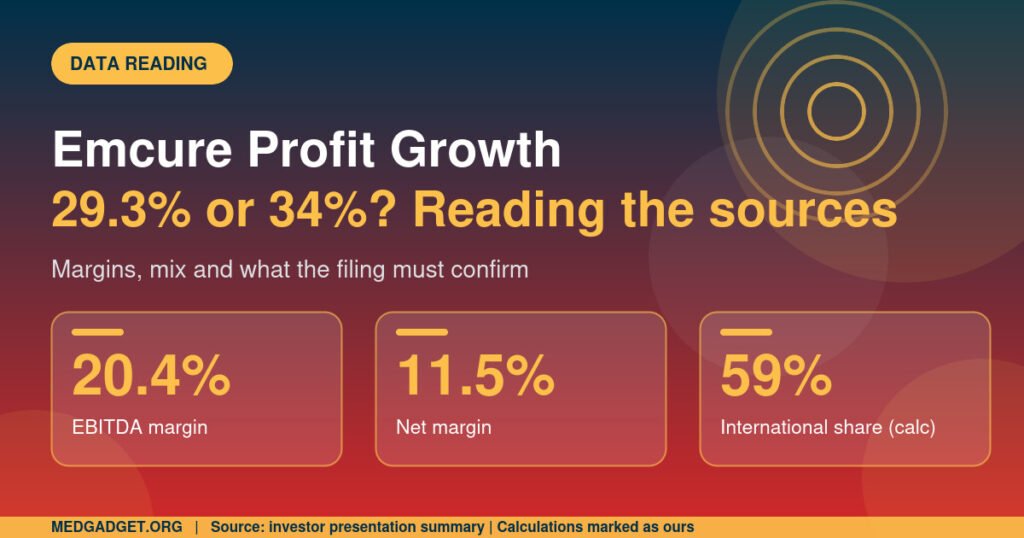

Reports of Emcure profit growth for the quarter ended 30 September 2026 do not agree: a summary of the company’s investor presentation gives net profit of ₹3,251 million, up 29.3%, while another report’s headline says 34% on ₹325.5 crore. Both describe the same quarter, and the gap matters for anyone comparing results. This data-reading article walks through the reported figures, shows how the margins and segment numbers fit together, flags what does not add up, and lists what the stock-exchange filing needs to confirm. It is news reporting and not investment advice.
Key takeaways on Emcure profit growth in Q2 FY27
- Net profit: ₹3,251 million, up 29.3% year on year, a margin of 11.5% (up 45 basis points).
- A separate report gives 34% growth on ₹325.5 crore; the discrepancy is unexplained.
- Revenue: ₹28,205 million, up 24.3%; EBITDA ₹5,748 million, up 30.9%, margin 20.4%.
- Gross margin was 59.5%, up 108 basis points quarter on quarter but down 131 basis points year on year.
- The adjusted versus reported profit split is not disclosed.
Why two growth rates can exist
When two sources give different growth for the same profit figure, the usual explanations are different bases (reported against adjusted profit), different prior-year comparisons or a transcription error. The material available does not say which applies here. It is worth noting that ₹3,251 million and ₹325.5 crore are essentially the same amount, since one crore is ten million, so the difference lies in the growth rate and not in the profit level. We use 29.3%, which matches the summary and the web address of one report, and we flag the other figure as unresolved.
How the margins fit together
| Line | Value | Change |
|---|---|---|
| Revenue | ₹28,205 million | +24.3% |
| Gross margin | 59.5% | +108 bps QoQ; minus 131 bps YoY |
| EBITDA | ₹5,748 million | +30.9% |
| EBITDA margin | 20.4% | +103 bps |
| Net profit | ₹3,251 million | +29.3% |
| Net margin | 11.5% | +45 bps |
By our calculation, EBITDA of ₹5,748 million over revenue of ₹28,205 million gives 20.4%, and net profit of ₹3,251 million over revenue gives 11.5%, so the margin figures are internally consistent. EBITDA grew faster than revenue, which points to operating leverage: costs rose more slowly than sales. The year-on-year dip in gross margin suggests that mix or input costs were less favourable than a year earlier, so the gain came from lower operating costs per rupee of sales.
A checklist for checking a results summary
Summaries of investor presentations are convenient but can introduce errors, especially when produced quickly. A simple routine helps. First, confirm that the segment figures add up to the reported total, which they do here. Second, recompute the margins from the stated rupee amounts. Third, check that percentage shares match the rupee figures, which fails here for the international share. Fourth, compare the prior-year base in the filing with the growth rate quoted. Fifth, look for any statement of one-off items or adjustments. Applying these steps does not replace the filing but shows where the summary is most likely to be wrong, and here it points to the profit growth rate and the international share.
A second caution concerns operating leverage. Profit growing faster than revenue is usually welcome, but it can reflect temporary factors such as delayed hiring, lower promotional spend or favourable currency moves, and the available material does not say which of these, if any, applied. Readers should therefore treat the margin gain as a fact about this quarter and not as a guarantee about the next.
Segment arithmetic
International sales were ₹16,652 million, up 34.5%, made up of Europe ₹6,043 million (up 36.0%), Canada ₹4,312 million (up 24.0%) and the rest of the world ₹6,297 million (up 41.1%). Domestic sales were ₹11,553 million, up 12.0%. These sum to the revenue total. The source says international was 78.6% of revenue, but the rupee figures give about 59% by our calculation, so that percentage appears to be an error.
Cash flow and balance sheet
First-half cash from operations was ₹7,235 million against ₹2,562 million a year earlier, and first-half net profit was ₹6,176 million, up 33%. Net debt rose to ₹13,171 million from ₹10,538 million in March 2026, which the summary attributes to the Mantra earn-out and Gennova consolidation payments. Net debt to EBITDA is quoted at 0.6 times and return on capital employed at 24.9%. These are company figures and have not been independently verified.
Guidance
The company now expects FY27 revenue growth above 20%, raised from mid-teens, with EBITDA margin expansion near the upper end of 75 to 100 basis points and net cash targeted by FY2028. These are forward-looking statements.
Timeline
- 3 November 2026: Q2 FY27 results announced.
- Same period: conflicting profit-growth figures appear across reports.
- FY27 and FY2028: guidance and net cash targets.
Market context
Acumen Research And Consulting’s Pharmaceutical Market report projects growth from USD 1.5 trillion in 2022 to USD 2.8 trillion by 2032, a compound annual growth rate of 6.4% for 2023 to 2032, with North America at about 38%. The page also carries a conflicting 38.4% growth figure and dates from July 2024, so it is indicative only. It describes the global market and does not measure Emcure.
Our analysis
In our assessment, the margin and segment numbers are mutually consistent, which raises confidence in the summary, but the profit growth discrepancy shows why filings matter. The strong cash generation is a positive, while the debt rise reflects acquisition payments. The key checks are the reported net profit and its prior-year base in the exchange filing.
What is not disclosed
- Adjusted versus reported profit.
- One-off items.
- Therapy-level sales.
- Assumptions behind the guidance.
Risks and caveats
- Figures are from a presentation summary and press reports.
- Profit growth conflicts between sources.
- Guidance is not a result.
- This article is not investment advice.
What to watch next
- The exchange filing and any restatement.
- Q3 FY27 margins.
- Debt reduction progress.
- Domestic growth trend.
General background
Related coverage: growth in the Indian pharma market. Company filings are available on the NSE and BSE sites. More in the Pharmaceutical category.
Questions readers are asking about Emcure profit growth
Was Emcure profit growth 29.3% or 34%?
Sources differ; 29.3% matches the presentation summary, and the 34% figure is unexplained.
Did margins improve?
EBITDA margin rose 103 basis points to 20.4%.
Is net debt rising?
Yes, to ₹13,171 million from ₹10,538 million in March 2026.
FAQ
What is a basis point?
One hundredth of a percentage point.
What is operating leverage?
Profit growing faster than sales because costs rise more slowly.
What is ROCE?
Return on capital employed.
How we reported this: figures come from a summary of Emcure Pharmaceuticals’ investor presentation and press reports; market figures are attributed to Acumen Research And Consulting; calculations marked as ours are our own. Last updated 5 November 2026. This is news reporting and not investment advice.