
Alembic Pharma profit growth in the quarter ended 30 September 2026 has been reported as anything from 74% to 94%, depending on the source, with the headline most often given as 81%. For readers who care about evidence, that spread is itself a story about how to read financial results. This article looks at what the numbers support, how base effects and definitions can explain differences, and what the segment data say about the quality of the profit jump.
Key takeaways on Alembic Pharma profit growth
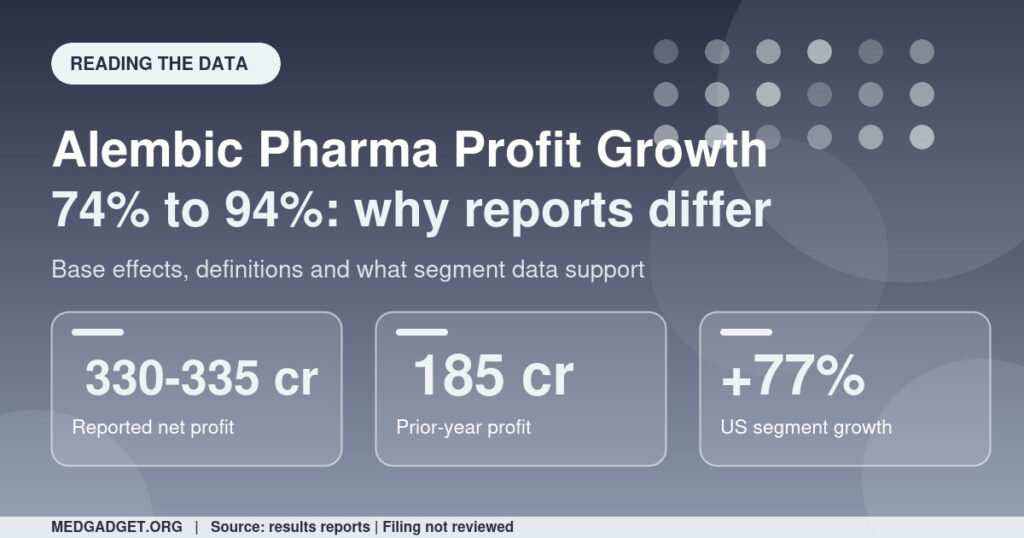
- Net profit was about ₹330 crore to ₹335 crore against ₹185 crore a year earlier, depending on the report.
- Growth rates of 74%, 78%, 81% and 94% appear in different reports; the 81% figure fits ₹335 crore against ₹185 crore.
- Revenue rose about 36% to roughly ₹2,603 crore; EBITDA rose about 78%, with a margin gain of about 520 basis points.
- US sales grew 77%, API 39%, India branded 14% and ex-US 12%.
- R&D was steady at about 8% of revenue.
Checking the arithmetic
A good first test of any reported growth rate is to check it against the two figures it connects. If profit was ₹185 crore a year ago, ₹335 crore implies growth of about 81%, and ₹330 crore implies about 78%. These are our calculations. A figure of 74% would imply a prior-year base of about ₹190 crore, and 94% a base of about ₹170 crore, which suggests those reports used different comparison figures, for example a restated or adjusted base. The sources do not say so, and we cannot resolve the difference without the filing.
| Reported growth | Implied prior-year base (our calculation) | Comment |
|---|---|---|
| 74% on ₹330 crore | About ₹190 crore | Different base or definition |
| 78% on ₹330 crore | ₹185 crore | Consistent with the stated prior-year profit |
| 81% on ₹335 crore | ₹185 crore | Consistent with the stated prior-year profit |
| 94% | About ₹170 crore | Basis unknown |
What drove the profit
Revenue rose 36% and EBITDA 78%, so profit grew faster than sales because margins widened. Gross margin was reported at 73.7%, up only 70 basis points, which tells us that the main gain came from operating leverage and not from a higher gross margin. In plain terms, the company sold much more without a matching rise in operating costs, and R&D, at 8% of revenue, did not eat into the gain.
Where the growth came from
The US segment grew 77%. If US formulations were about ₹1,003 crore, as one report states, the implied prior-year base is roughly ₹567 crore (our calculation), so the segment added about ₹436 crore. That is most of the roughly ₹690 crore revenue increase we estimate for the group. India branded formulations grew 14%, ex-US 12% and API 39%. The evidence therefore points to a US-led quarter, with the other segments contributing steady growth.
What the numbers cannot tell us
- Whether US growth reflects new launches, volume or price: the sources do not say.
- Whether any one-off item affected profit: none was mentioned, but we cannot rule it out without the filing.
- Whether the margin gain is sustainable: it depends on US sales holding up.
- How rupee revenue splits between India, API and ex-US: not given.
Timeline
- 30 September 2026: quarter ends.
- Early November 2026: results announced.
- Outlook as summarised: continued growth and return on capital employed of about 15% to 16%.
Market context: active pharmaceutical ingredients
Acumen Research And Consulting’s Active Pharmaceutical Ingredient Market report, updated in June 2026, gives USD 255.47 billion in 2025 and USD 473.20 billion by 2035, a compound annual growth rate of 6.3% for 2026 to 2035. North America held over 39%, Asia-Pacific 25% and Europe about 22%. Synthetic APIs were 74% of the market and merchant manufacturers 58%.
The page has minor inconsistencies: its title says 2026 to 2035 while a heading says 2026 to 2036, and compounding 6.3% for ten years gives about USD 470 billion, slightly below the stated figure. The data are global, not Alembic’s, and offer context only for the API segment, which grew 39% in the quarter.
Our analysis
In our assessment, the sensible reading of the evidence is that Alembic had a very strong quarter in which profit roughly doubled from a modest base, and that the spread in reported growth reflects different bases and rounding more than any dispute about the facts. A low prior-year base amplifies growth rates: the ₹185 crore a year earlier was itself only 20% above the year before. Percentage growth should therefore be read alongside absolute profit and margin.
What is not disclosed
- The company’s own filing figures as seen in the reports reviewed.
- The reason for differing growth rates between reports.
- Segment rupee values for API, India and ex-US.
Risks and caveats
- We did not review the filing; figures come from press and data-provider summaries.
- Growth percentages depend on the comparison base.
- Market data are global and not company-specific.
- This article is not investment advice.
What to watch next
- The filing itself on the exchange websites, to settle the figures.
- US sales in the third quarter.
- Management commentary on launches and sustainability of margins.
- Any restated comparatives.
General background
Company information is at Alembic Pharmaceuticals and exchange filings at BSE. Related coverage: India pharmaceutical market growth in 2026 and the Pharmaceutical section.
Questions readers are asking about Alembic Pharma profit growth
Which growth figure is right?
The 81% figure fits ₹335 crore against ₹185 crore, but the filing should be checked.
Why do reports differ?
Different comparison bases, rounding or definitions are likely, though the sources do not say.
Is the jump due to the US?
Largely, by our calculation: US formulations account for most of the revenue increase.
FAQ
What is a base effect?
When growth looks large because the starting figure was low.
What is operating leverage?
When revenue grows faster than operating costs, so profit grows faster than revenue.
What is the R&D share?
About 8% of revenue.
How we reported this: details come from reports of Alembic Pharmaceuticals’ Q2 FY27 results; we did not review the filing, and calculations marked as ours are our own. Market figures are attributed to Acumen Research And Consulting. Last updated 4 November 2026. This is news reporting and not investment advice.